Modeling and Simulation


A model is a notional description of the nexus of a real system in a mathematical form. A mathematical model consists of algebraic equations and differential equations based on physically regularities.

Simulations are experiments based on developed Models implemented into a computer program. By using simulations, knowledge of the model can be achieved, which can be transferred to reality.

The importance of numerical simulations rose drastically during the last decades. Due to the raising requirements on NDT results and the need of high-level NDT methods, simulation plays also a key role in this sector. Models and simulations are used in many steps in the NDT process, e.g. for the development of and verification of new inspection methods. Modelling and simulations enable a fast and economic analyzes of complex systems therefore the developing time and costs can be reduced.

In our group modelling and simulation is used to develop and verify new NDT evaluation methods and to reconstruct defects. Thereby the conjunction of finding and evaluating defects can be realized. Therefore physical models are used to solve the forward problem to thereafter use the results of the forward problem to solve the inverse problem. The main goal of solving the forward problem is to calculate a temperature field T(x,y,z,t) in a solid body assuming that all causal conditions are known. The term causal conditions means the knowing of the material parameters as well as the initial- and boundary conditions. For inverse problems the temperature field is known and by using a proper mathematical algorithm the cause (e.g. material parameter) can be calculated. The relation of the direct- and the inverse problem is shown in Figure 1.
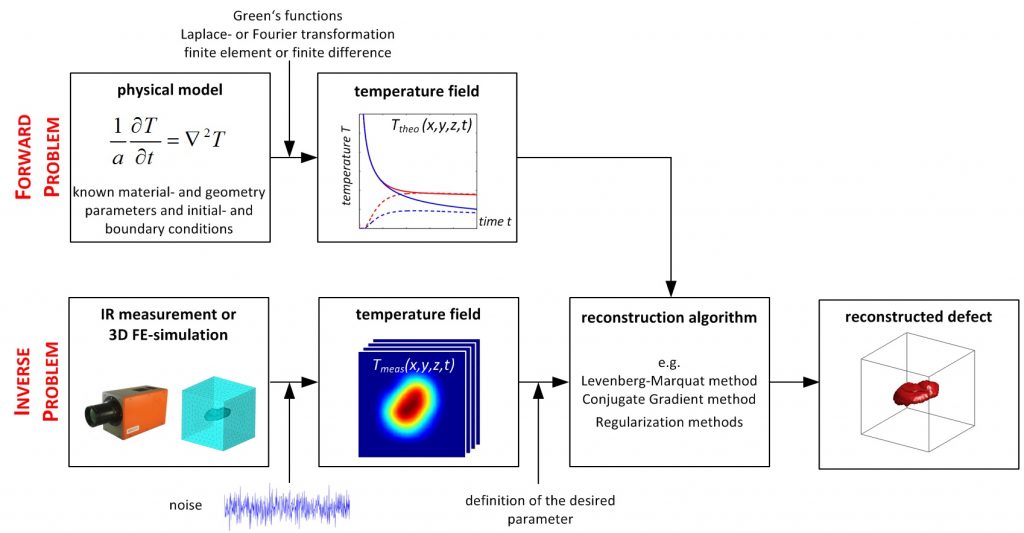
Figure1: Forward and inverse problem based on a singular inclusion

Applications


3D-Modelling of a pulse thermography experiment applied on porous CFRP-media

The porosity is a critical defect class in CFRP structures. High concentrations of pores can reduce the interlaminar shear strength, the compressive strength and the flexural strength of the material. Because of the small geometric dimensions pores can’t be detected as a single defect with conventional active thermography methods. High porosity content has a significant impact to the thermal conductivity and the thermal diffusivity, which can be determined by using active thermography measurements. By using physical models and simulations the relations between microstructural properties, such as shape distribution and quantity of the pores and the resulting effective thermos physical properties were be investigated. Numerical 3D simulations based on FEM were used to calculate the temperature field and the resulting gradient field of the heat flux of porous CFRP media.


The geometric model of the specimen used in the simulation is based on 3D-XCT measurements. The numerical calculations are carried out by using steady and non-steady heat conduction equation. The results of the numerical simulation in combination with analytical solutions of the heat conduction equation are used to calculate the local thermal diffusivity and the thermal conductivity. By determining these parameters the porosity of the investigated sample can be calculated. Figure 2 shows a schematic illustration of the simulation and modelling process.

Figure 2: Schematic illustration of the process to determine the porosity content of a CFRP-sample, by using microstructure based on 3D-XCT results

Determine material parameter out of pulse thermography measurements

In this work numerical simulation based on FEM and physical modelling was used to develop and to verify a method to determine material parameters out of Active Thermography measurements in reflection mode. During the measurement the temperature decay is recorded at discrete time steps. After the measurement three trial functions based on physical models for the respective time regions are fitted to the recorded data to get a continuous temperature curve. The continuous description of the temperature curve enables a variety of ways for further mathematical data processing to evaluate the measurement results.


In this evaluation method a further data processing is realized in the frequency domain. Therefore the continuous temperature curve is transformed into the frequency domain to calculate the phase curve. To solve the inverse problem and thereby to determine material parameters out of measurement results, the Green’s function method is used to solve the heat conduction equation analytically in the frequency domain. The phase curve of the analytical solution of the heat conduction equation is fitted to the phase curve of the transformed continuous temperature curve. Due to the fit of the analytical solution to the transformed trial functions material parameters of the examined sample can be determined. A schematic illustration of the procedure is shown in Figure 3. Figure 4. a shows the fit of the trial functions to the recorded temperature curve in a log-log scale. The relative deviation of the fitted function is given in Figure 4. b.

Figure3: Model of the data processing procedure

a: Contributions of the trial functions TF1-TF3 to the calculated temperature curve
b: Relative deviation of the fitting procedure